Back To Home
The Story Behind the Weather - By Forecaster John
Ensworth M.S. -
The Discussion of Weather Events Daily for Philadelphia and Pennsylvania
last updated: 09/14/2003 02:17 PM
We'll start this morning with the fact that the low pressure system that slid past over the last two days is off the map to our distant north east. It left a front draped right across the state (as shown below). This image is a surface map with an infrared satellite picture overlaid on it. This is a focus for the showers in the western part of the state (see the next image).
Here are the showers at this hour (10am on Thursday). You can make out the frontal zone as the connect-the-dots areas of precipitation stretching from southern Michigan off the Mass. coast to the east-northeast.
Aside from the fact that all the ground everywhere is soaked and flash flooding (or urban flooding in the city) is possible wherever rainfall starts... There is a risk of severe weather today. The front should pull north and mostly clear skies and much warmer, moist air will spread into at least the southern half of PA. There was a moderate risk (out of slight, moderate, and high) of severe weather forecast for southeast PA (including the Philadelphia area) overnight, but due to cooler temperatures expected at the surface, it has been nipped back to a slight risk. Don't be fooled though, severe weather is possible today for much of the state especially the southern half. The following map shows the region of slight risk, while the next two maps show what the risk is.
One of the risks you need to be aware of is of hail (especially hail of 2" or larger!). This is expected to be of greatest threat (15% chance of hail that size or larger happening within 25miles of a point in the risk area).
Then there is the risk of high winds...these are wind gusts >65mph. There is 15% to 25% chance of winds this strong (within 25 miles of you) as you move south across the state. Batten down the hatches!
Here is the official discussion from the Severe Storms Forecast Office in Norman, OK. I'll translate and illustrate it below.
...UPPER OH VLY EWD INTO THE MIDDLE ATLANTIC... WAVE IMAGERY SHOWS A FAIRLY POTENT VORT MAX MOVING UP THE OH VLY. AIR MASS SITUATED ACROSS THE TN VLY AND ACROSS THE MIDDLE ATLANTIC WILL SURGE NEWD AHEAD OF DEEPENING SURFACE LOW. MORNING SATELLITE SUGGESTS THERE WILL BE POTENTIAL FOR HEATING...ESPECIALLY ACROSS KY INTO THE UPPER OH VLY AND ACROSS THE MIDDLE ATLANTIC NEWD INTO SCNTRL/SERN PA. GIVEN UNIDIRECTIONAL FLOW...WITH H5 JETLET OF 30- 40 KTS PUNCHING NEWD INTO THE REGION THIS AFTERNOON...AND INFLUX OF MOIST/UNSTABLE AIR MASS...SET-UP WILL FAVOR BANDS OF TSTMS. THESE BANDS WILL MOVE QUICKLY ENEWD ACROSS THE REGION...POSSIBLY EVOLVING INTO SMALL SCALE BOWS/LEWPS GIVING MAINLY WIND DAMAGE.
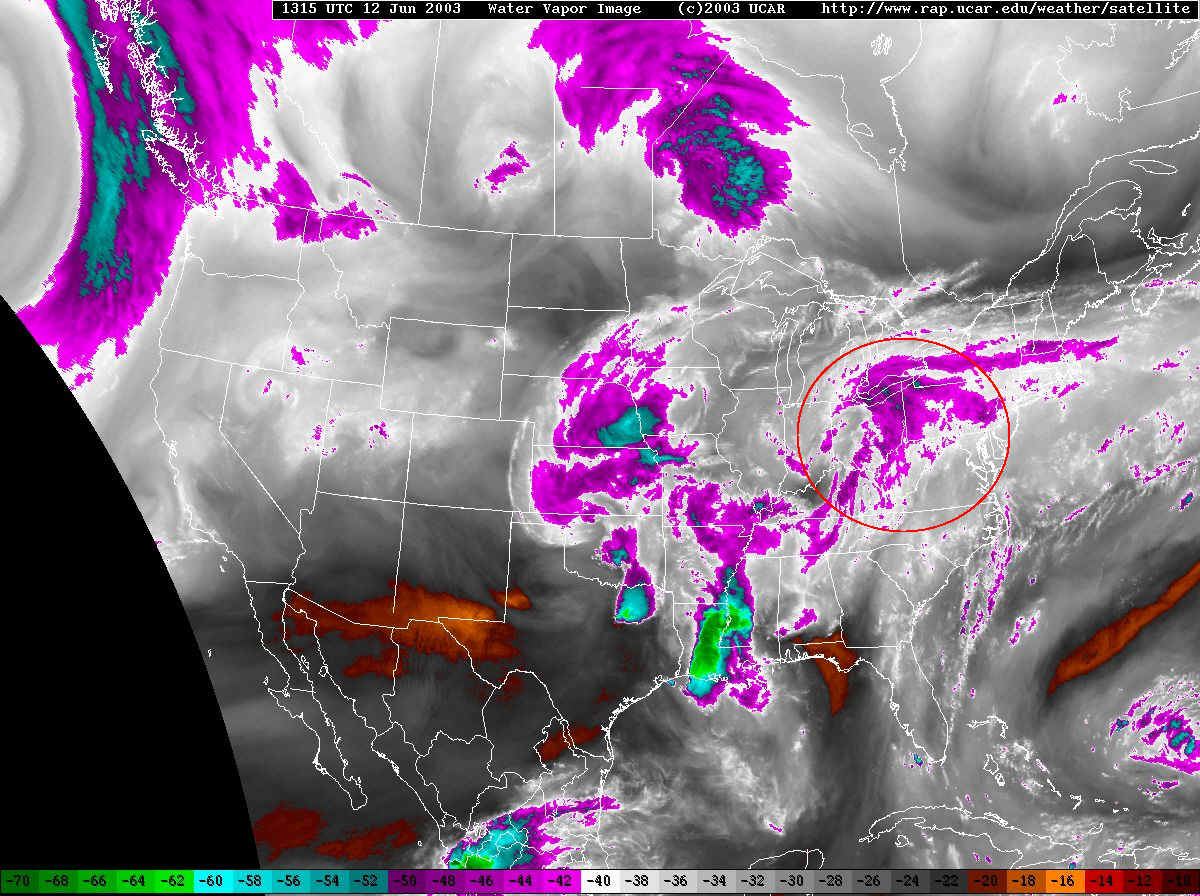
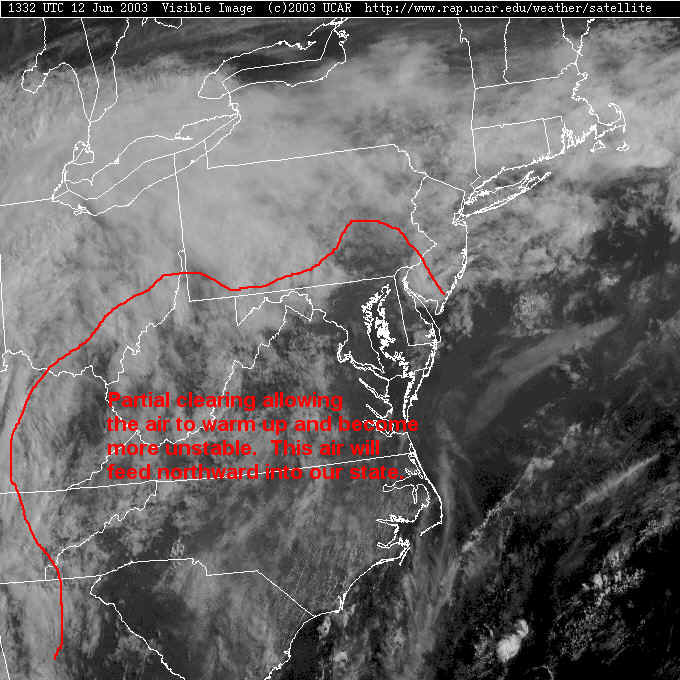
...The upper Ohio Valley eastward into the middle Atlantic region... Satellite water vapor/wave imagery shows a fairly potent vorticity maximum (short wave in the 500mb maps) moving up the Ohio Valley this morning (see Picture A below). The air mass (all the air that has been sitting there for a while) situated across the Tennessee Valley and across the middle Atlantic (states) will surge northeastward ahead of the deepening surface low (in Indiana - see the map at the top of this page). The morning satellite suggests there will be a potential for heating...especially across Kentucky into the upper Ohio Valley and across the middle Atlantic northeastward into central and southeastern PA (our home town) (see the clearing areas labeled here on the visible satellite Picture B below). Given unidirectional flow (Picture C - little change in wind direction with height) and with 500mb jetlet (jet streak - or small area of faster winds that allow thunderstorms to intensify by lifting more warm moist air into them - see Picture D) punching northeastward into the regions this afternoon...and with the influx of moist/unstable air mass... the set up will favor bands of thunderstorms. These bands will move quickly east-northeastward across the region - possibly evolving into small scale bow echo features on radar that can result in powerful straight line winds that result in damage to homes and trees, etc.
So watch out for severe weather with this next round of rain, and watch for the storms in the Great Plains to move up towards us over the weekend. Wet wet wet!
Meteorologist John Ensworth, M.S.
PICTURE A - see the red circle for the ripple and clouds associated with the vorticity maximum.
Picture B:
Picture C- a vertical sounding. This shows the temperature (red line), moisture (green line) and winds (circled with a big red oval). The wind direction is read by going from feathers to tip on each arrow (the tip is connected to the vertical black line). Up the screen is north, right is east, down is south and left is west. The unidirectional statement above means these are all coming from the same direction with height. And you can see, the winds are coming from the west-southwest all the way up.
Picture D - The 500 mb map again. The area circled in purple shows the area where the winds are stronger. The wind arrows work here just like they do in the picture above. And you can tell the wind speed in both images by counting the 'feathers' on the arrows. One full feather is 10knots (very similar to 10mph). A half feather is 5 knots, and a triangle is 50knots.