Back To Home
The Story Behind the Weather - By Forecaster John
Ensworth M.S. -
The Discussion of Weather Events Daily for Philadelphia and Pennsylvania
last updated: 09/14/2003 02:18 PM
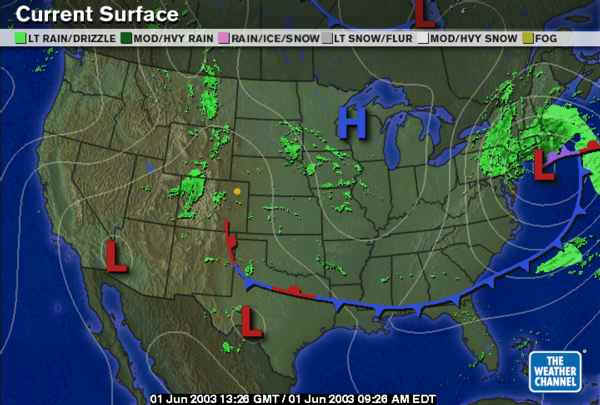
Welcome to another rainy day! The gigantic storm system that slammed the east coast is beginning to move out to sea, but a large shield of rain is sliding around the back side of the low to drench us for the morning at least. But, as you can see on the surface map below, the back edge of the rain is already one half the way across the state and pulling east. The thin white lines on the map are the isobars, or lines of equal surface barometric pressure (adjusted to sea level). The closer together the lines are, the stronger the winds, the more spaced out they are, the weaker. (This is due to the reason the wind blows. Differences in pressure over distance make the pressure gradient. The stronger the force that arrises from this pressure gradient (the pressure gradient force) the stronger the wind.) The lines of equal pressure are fairly close together this morning since the low is still fairly close to us. That is why it is not only rainy, but quite windy today.
The visible satellite picture (below) shows the thick cloud cover extending further to the west this morning covering more of the state. As is quite normal for storm system like this, the rain will end a while before the sun comes out.
We do have some flooding associated with the rains of the last day and a half. Here are the current watches in effect. But the Philadelphia area is not included in these watches at this time.
In Philadelphia, we received (as shown in the chart below) 0.33" of rain. We are now a bit over the normal for the month of May and almost perfectly normal for the year. Last year, at this point, we were about 5" below normal. That's a positive change!
| Yesterday Actual Normal Record Last Year | ||||
|---|---|---|---|---|
| High temperature | 73° | 77° | 97° (1991) | 91° |
| Low temperature | 60° | 60° | 42° (1965) | 66° |
| Precipitation | 0.33 " | 0.11 " | 1.65 " ( 1993 ) | 0.03 " |
| Month-to-date precip. | 4.18 " | 3.89 " | -- | 3.57 " |
| Year-to-date precip. | 17.41 " | 17.45 " | -- | 12.75 " |
The odd graphic below shows one of the neater products from the National Weather Service's Doppler Radar - and that is precipitation totals. Many places from Straton to Syessett and New York City received up to 2-3 inches in the last day or so. And though the airport in Philadelphia only received a third of an inch of rain, you can see that some places near the city got up to an inch or more.
And finally, the graphic below takes a look at the next nine days across the U.S. It is the forecast of surface rainfall and surface pressure across North America (look closely to the red lines for the state outlines and PA to the right of center). It is difficult to look at, so take a moment. This is the output of a computer model called the GFS (The Global Forecast System model - formally called the MRF - Medium Range Forecast model) . It shows a rain free period from Monday through Wednesday with showers approaching from the south on Thursday (the date is to the upper right of each frame). Friday looks showery. Saturday looks like a break before a line of thunderstorms slides out of the plains toward the east coast. And if you can believe it out that far, Monday of next week looks showery with a break again on Tuesday and again more rain on Wednesday. We'll see if this all comes to pass.
Have as dry of a Sunday as you can!
Meteorologist John Ensworth, M.S.
(This page sometimes contains sources from AccuWeather.com www.accuweather.com ).